Raster parallel process in R
By Fidel Maureira Sotomayor
Install libraries if there are no already in your computer.
 1packages = c('raster','terra', 'snow', 'parallel', 'foreach','doParallel','rasterVis', 'mapview','ggplot2', 'lubridate','pryr')
 2out = sapply(packages ,  function(p){
 3  print(p)
 4  if(require(p,character.only = TRUE)==FALSE) {
 5    install.packages(p)}
 6
 7    require(p,character.only = TRUE)  })
 8
 9
10
11my_function = function(r, na.rm=TRUE, fun=mean) {
12  fun(getValues(r), na.rm=na.rm)
13}
Download files, alternative is possible use the function raster::getData. More details on https://worldclim.org/data/worldclim21.html
1temp <- tempfile()
2tempd <- tempdir()
3#download worldclim climate data
4download.file('https://biogeo.ucdavis.edu/data/worldclim/v2.1/base/wc2.1_10m_tavg.zip',temp, mode="wb")
5#raster::getData()
6unzip(temp, exdir=tempd)
7#dir(tempd) # explore the temp directory
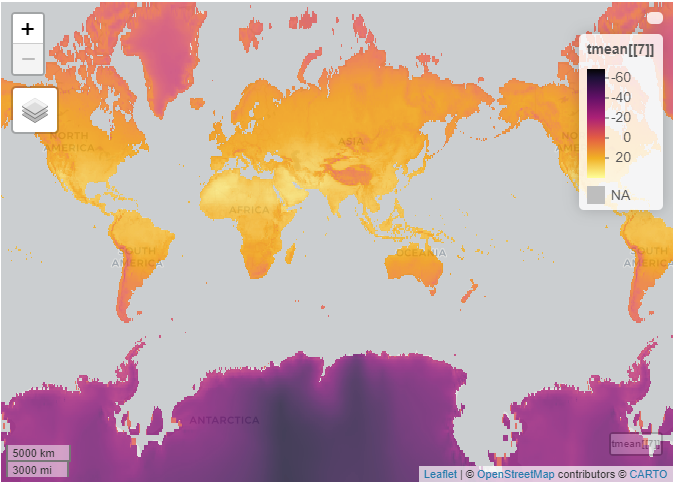
Explore the data
1file_names = list.files(tempd,'wc2.1_10m_tavg')
2tmean <- stack(file.path(tempd, file_names))
3mapview(tmean[[7]])
## Warning in rasterCheckSize(x, maxpixels = maxpixels): maximum number of pixels for Raster* viewing is 5e+05 ;
## the supplied Raster* has 2332800
##  ... decreasing Raster* resolution to 5e+05 pixels
##  to view full resolution set 'maxpixels =  2332800 '

## Warning in showSRID(uprojargs, format = "PROJ", multiline = "NO", prefer_proj =
## prefer_proj): Discarded ellps WGS 84 in Proj4 definition: +proj=merc +a=6378137
## +b=6378137 +lat_ts=0 +lon_0=0 +x_0=0 +y_0=0 +k=1 +units=m +nadgrids=@null
## +wktext +no_defs +type=crs

## Warning in showSRID(uprojargs, format = "PROJ", multiline = "NO", prefer_proj =
## prefer_proj): Discarded datum World Geodetic System 1984 in Proj4 definition

## Warning in rgdal::rawTransform(projfrom, projto, nrow(xy), xy[, 1], xy[, : 104
## projected point(s) not finite

## Warning in rgdal::rawTransform(projfrom, projto, nrow(xy), xy[, 1], xy[, : 104
## projected point(s) not finite

## Warning in showSRID(uprojargs, format = "PROJ", multiline = "NO", prefer_proj =
## prefer_proj): Discarded ellps WGS 84 in Proj4 definition: +proj=merc +a=6378137
## +b=6378137 +lat_ts=0 +lon_0=0 +x_0=0 +y_0=0 +k=1 +units=m +nadgrids=@null
## +wktext +no_defs +type=crs

## Warning in showSRID(uprojargs, format = "PROJ", multiline = "NO", prefer_proj =
## prefer_proj): Discarded datum World Geodetic System 1984 in Proj4 definition
Paraleling
Create cluster and load functions. Alternative you can create your own scrip file with function and just load this file.
1cl <- makeCluster(4, type='SOCK', outfile='log.txt')
2registerDoParallel(cl)
3out=clusterEvalQ(cl,library(raster))
4env= where('my_function')
5clusterExport(cl, list('my_function'),envir = env)
6#out =clusterEvalQ(cl, source('my_functions.R'))
We going to use two way of paralleling in R with the snow/parallel and foreach libraries.
1system.time({
2  clusterExport(cl,list('tmean'))
3  mean_planet = parLapply(cl,c(1:12), function(l){
4    my_function(tmean[[l]])
5  })
6  mean_planet = unlist(mean_planet)
7})
##    user  system elapsed
##    0.00    0.00    1.51
1system.time({
2  mean_planet2 = foreach(l = c(1:12),
3                         .combine = rbind,
4                         .errorhandling = 'remove') %dopar%
5    my_function(tmean[[l]])
6})
##    user  system elapsed
##    0.04    0.02    1.37
1results = data.frame(layer_name = names(tmean),
2                     month =  month(1:12,label=TRUE, abbr = TRUE),
3                     parLapply_out =mean_planet,
4                     foreach_out = mean_planet2)
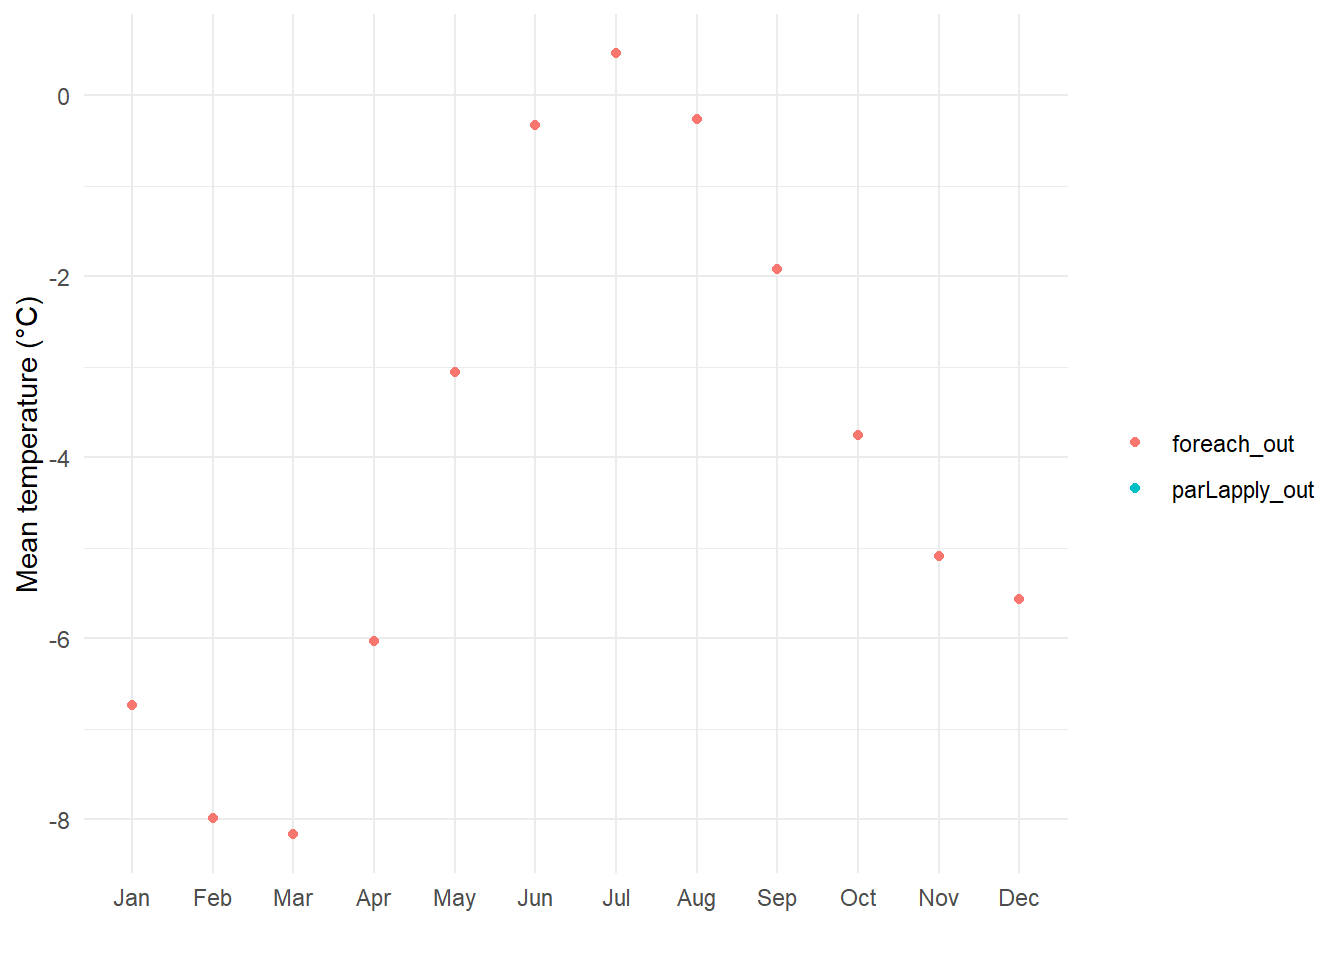
The first plot show the global mean temperature for each month. The second figure show that the two paralleling outcome the same results
1ggplot(results,aes(x=month,y=parLapply_out, col='parLapply_out'))+
2  geom_point()+labs(y='Mean temperature (°C)', col='', x='')+
3  geom_point(aes(y=foreach_out,col = 'foreach_out'))+theme_minimal()
Split large raster
We download the raster and make a split overlapped extent. The overlapped extent is only for the use of focus function, any other process should use a non-overlapped extent! Also is possible use the function focus in raster. but it is slower function.
1file_raster = 'https://www.dropbox.com/s/onp3f75pab7z3j9/intro-1508529851.jpg?dl=1'
2
3r_raster = stack(file_raster)
4e =extent(r_raster)
5extent_r =list(r1 =extent(0, floor(e@xmax/2)+2, 0, floor(e@ymax/2)+2),
6               r2 = extent(ceiling (e@xmax/2), e@xmax, floor (e@ymax/2), e@ymax),
7               r3 =  extent(0, floor (e@xmax/2)+2,  floor (e@ymax/2), e@ymax),
8               r4 =  extent(ceiling (e@xmax/2), e@xmax,  0, floor (e@ymax/2)+2))
We call the parLapply from a lapply environment, so we need export elements from this environment (env).
 1tmean_smooth = lapply(c(1:3) , function(l){
 2  env= where('l')
 3  clusterExport(cl, list('extent_r','r_raster','l'),envir=env)
 4  r_parts = parLapply(cl,seq_along(extent_r),function(part){
 5    r = r_raster[[l]]
 6    r_part <- crop(r, extent_r[[part]])
 7    #focal(r_part,w=matrix(1,3,3), fun='mean',na.rm=TRUE)
 8    terra::focal(r_part,w=matrix(1,3,3), fun='mean',na.rm=TRUE)
 9    #r_part
10  })
11
12  m1 <- mosaic(r_parts[[1]], r_parts[[2]],r_parts[[3]],r_parts[[4]], fun=mean)
13
14  m1
15})
16stopCluster(cl)
17#r_smooth = stack(tmean_smooth[[1]],tmean_smooth[[2]],tmean_smooth[[3]])
18r_smooth = do.call(stack,tmean_smooth)
19
20plotRGB(r_smooth)
21abline(v=390,h=219,col='green')
 Versus original
1plotRGB(r_raster)
 ##Visualization
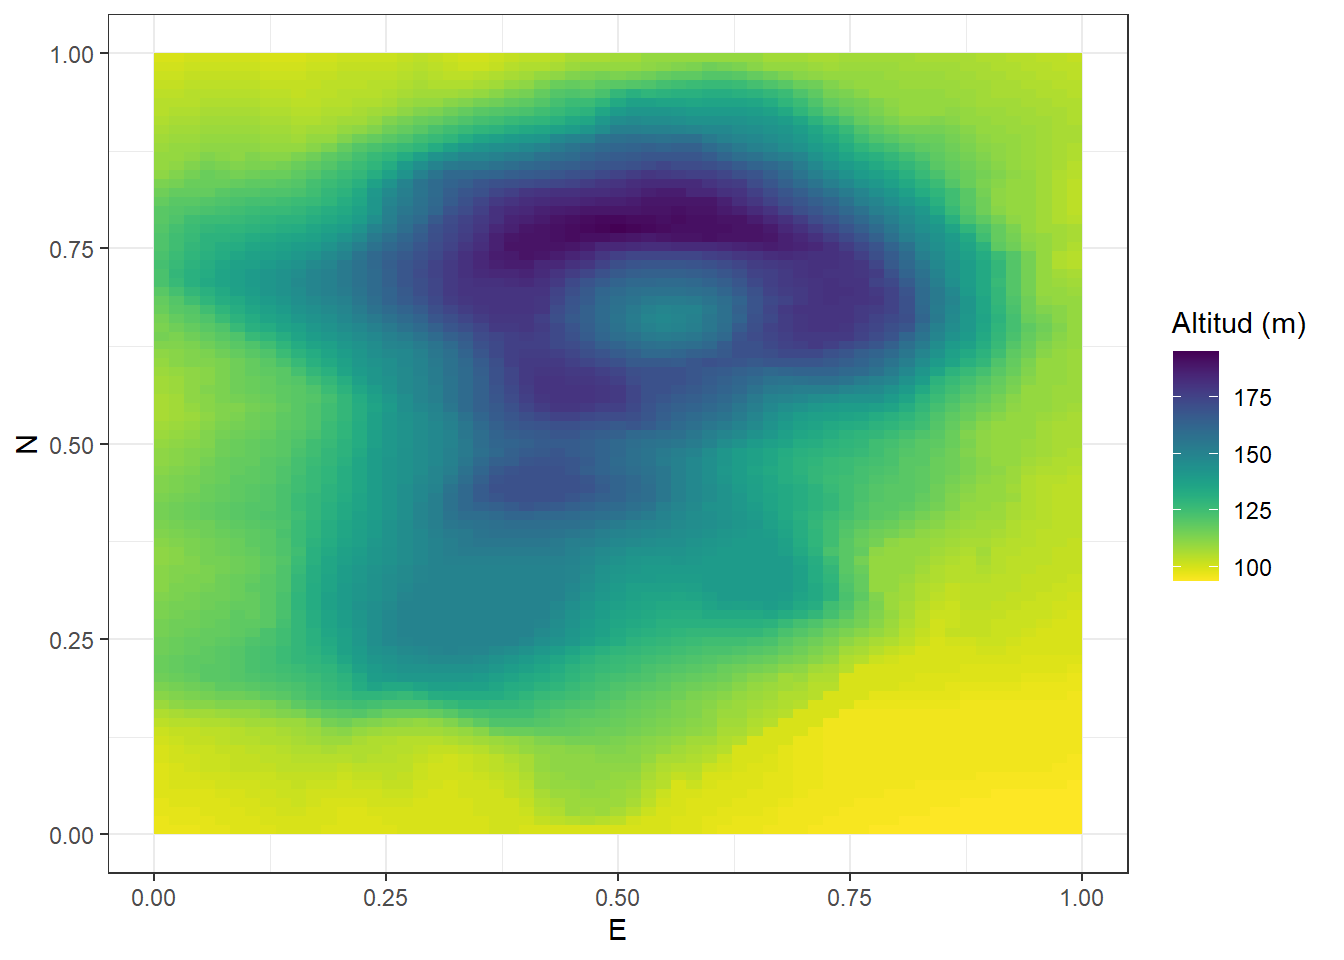
more info in https://oscarperpinan.github.io/rastervis/
1data(volcano)
2volcano = raster(volcano)
3library(viridis)
## Loading required package: viridisLite
1rasterVis::gplot(volcano) +
2  geom_tile(aes(fill = (value)))  +
3  viridis::scale_fill_viridis(direction = -1,
4                              na.value='#FFFFFF00') +
5  labs(fill='Altitud (m) ', x='E',y='N')+
6  theme_bw()
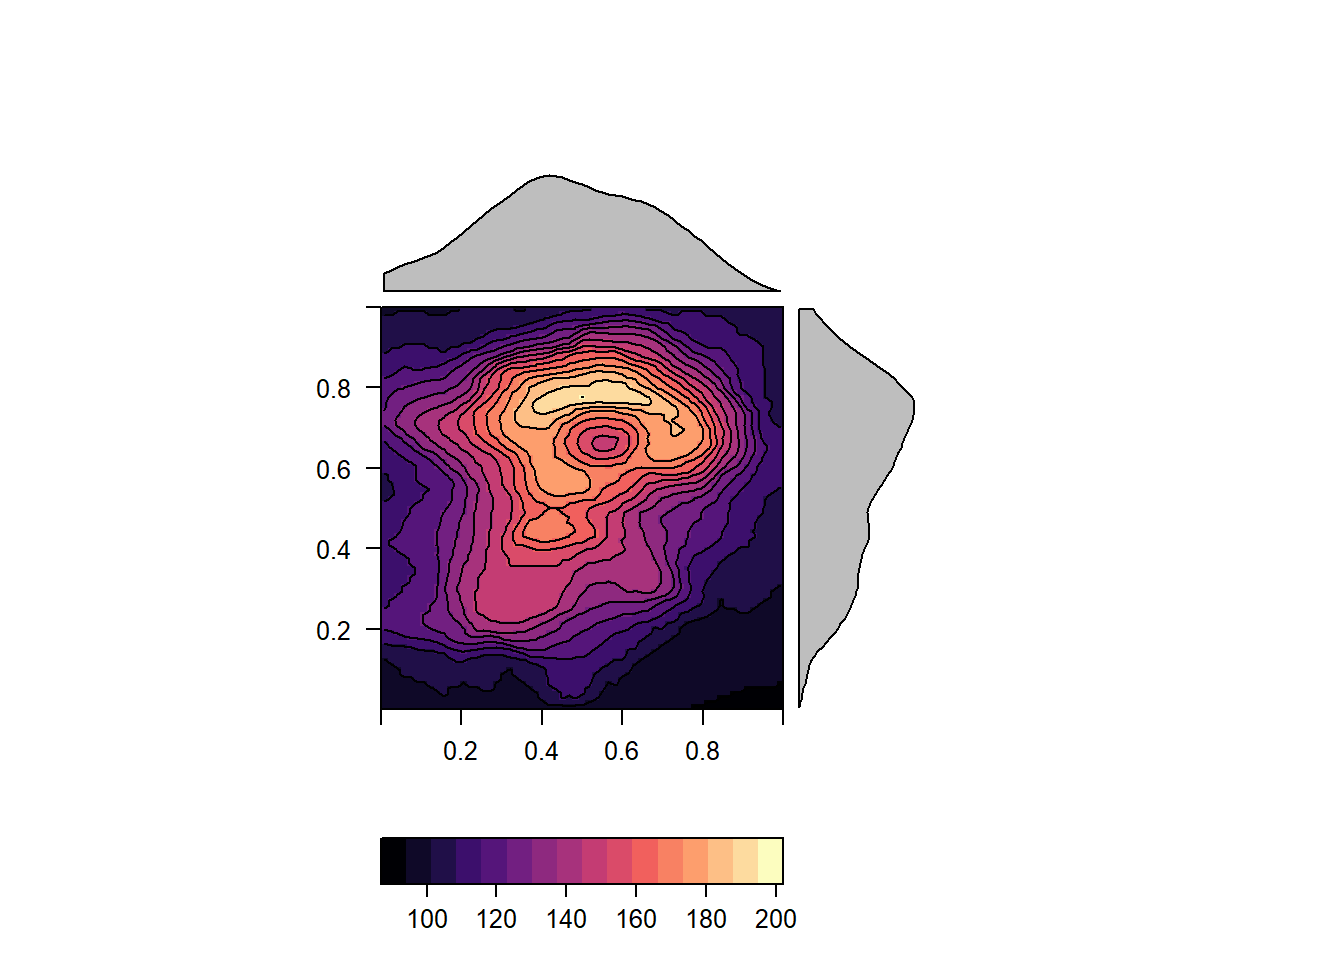
1levelplot(volcano,contour=TRUE)
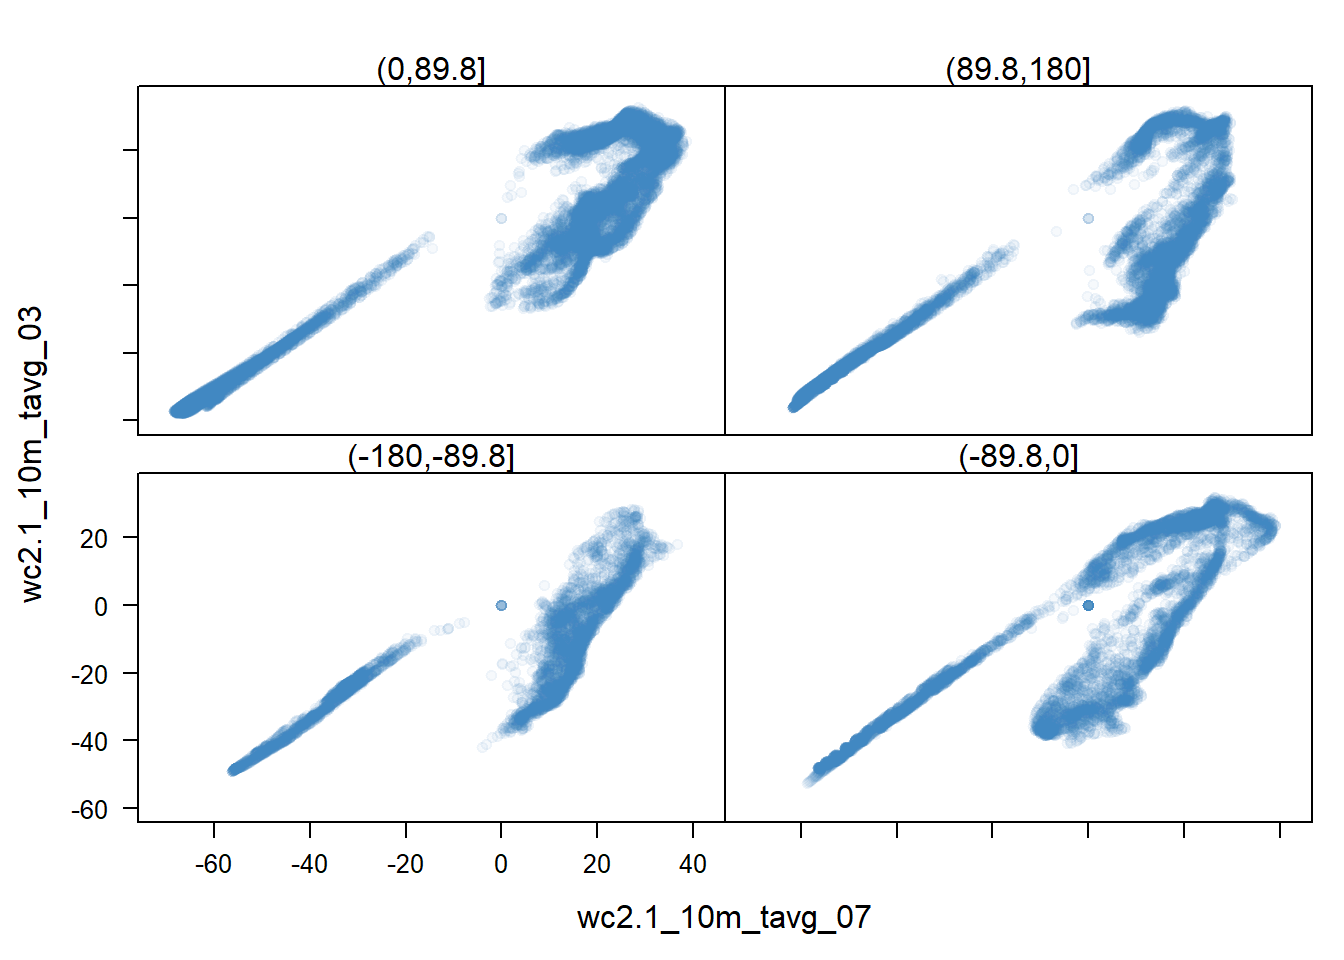
1xyplot(wc2.1_10m_tavg_03~wc2.1_10m_tavg_07|cut(x, 4), data = tmean, auto.key = list(space='right'))