How to Shiny
By Matt Brousil
Making our first shiny app:
Shiny is a package developed by RStudio. It allows you to build interactive apps online, displaying data, figures, etc. It's very flexible and only requires that you know how to use R in order to build an app.
Once you have an app written, it can be hosted online or even embedded into an R Markdown document.
RStudio provides a lot of materials (articles & videos) for learning Shiny right on its website. You can see the materials here.
We'll partially recreate an example from the RStudio gallery below.
Step 1: Create the blank app template
Shiny apps are made using R scripts, and require us to define two things: (1) a user interface, and (2) a server function.
The user interface ("ui") dictates all of the things that show up for the app user on a website, for example. The "server" function is the "under the hood" code that makes the app run calculations, build plots, and other tasks required for it to function. These two components can be specified in a single or two scripts.
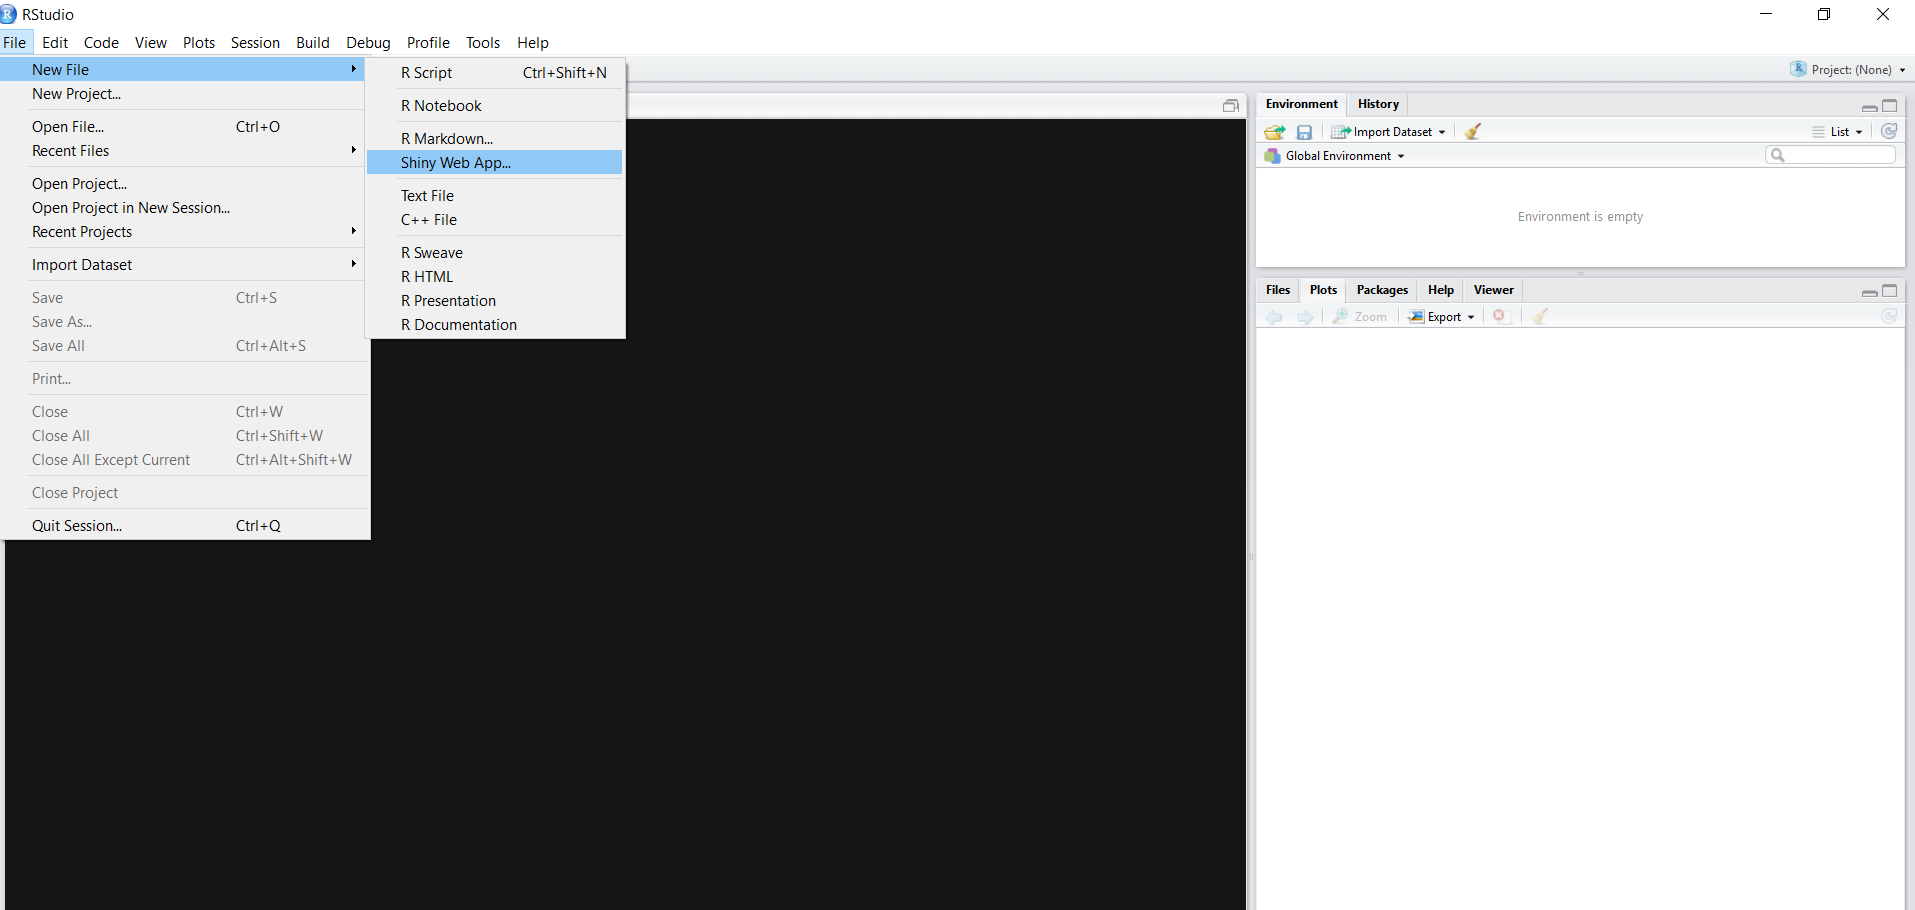
To do this in RStudio we go to File > New File > Shiny Web App
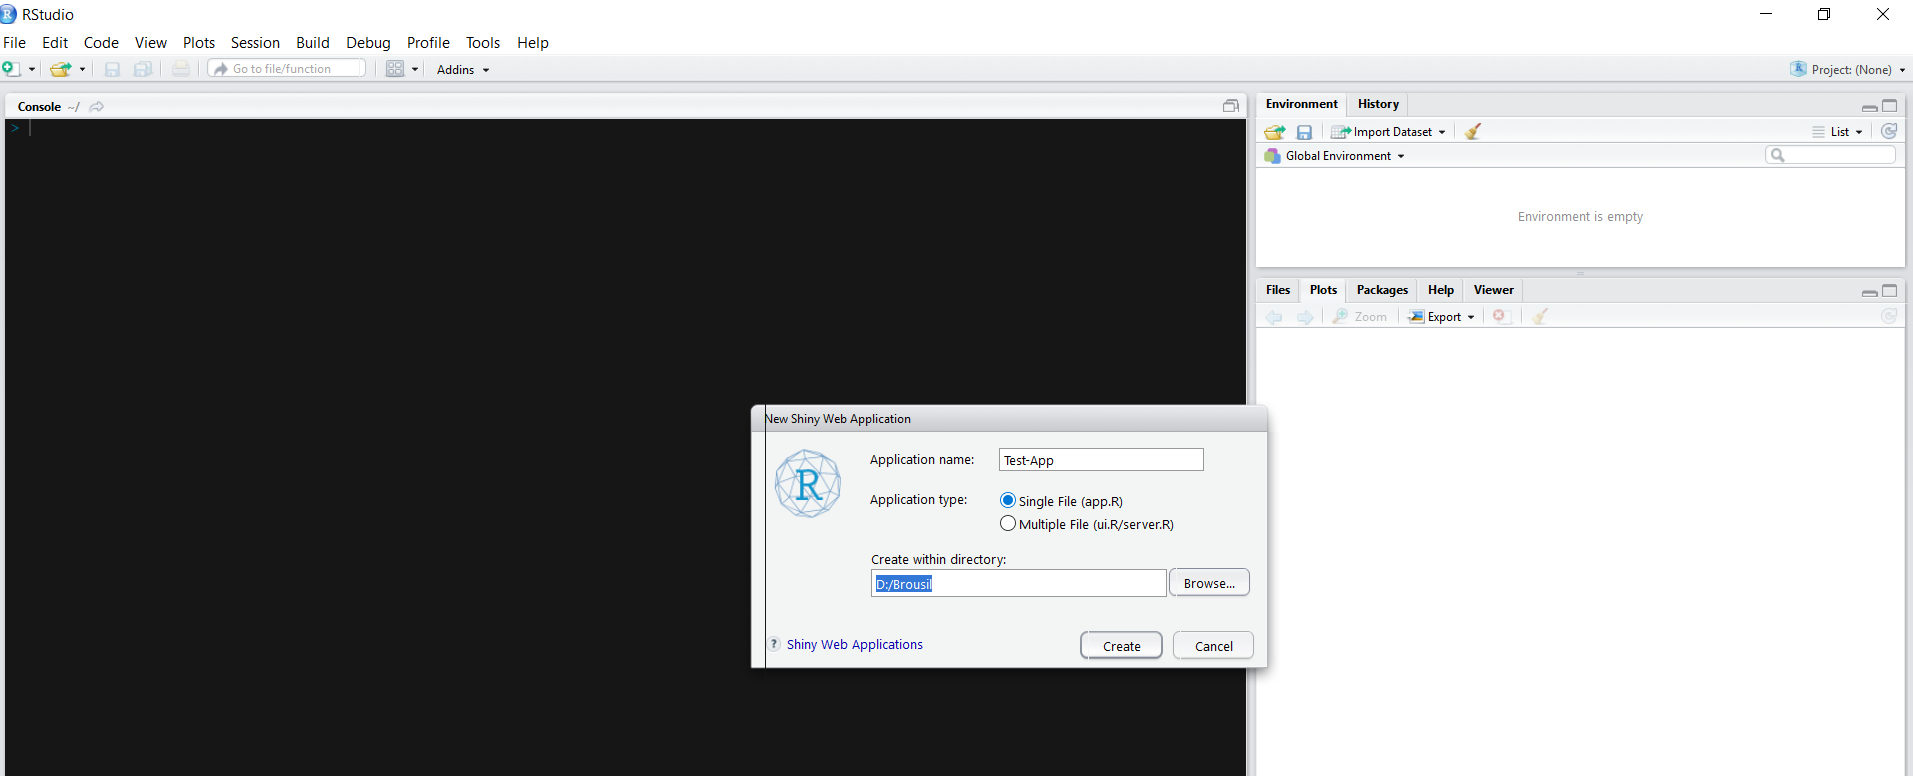
We then provide a name, and choose either a single file app or multiple files. Choosing single will put the ui and server function into the same script. Multiple will create a script for each component. Let's go with single.
The file app.R will then be created, which should look like this:
 1#
 2# This is a Shiny web application. You can run the application by clicking
 3# the 'Run App' button above.
 4#
 5# Find out more about building applications with Shiny here:
 6#
 7#    http://shiny.rstudio.com/
 8#
 9
10library(shiny)
11
12# Define UI for application that draws a histogram
13ui <- fluidPage(
14
15   # Application title
16   titlePanel("Old Faithful Geyser Data"),
17
18   # Sidebar with a slider input for number of bins
19   sidebarLayout(
20      sidebarPanel(
21         sliderInput("bins",
22                     "Number of bins:",
23                     min = 1,
24                     max = 50,
25                     value = 30)
26      ),
27
28      # Show a plot of the generated distribution
29      mainPanel(
30         plotOutput("distPlot")
31      )
32   )
33)
34
35# Define server logic required to draw a histogram
36server <- function(input, output) {
37
38   output$distPlot <- renderPlot({
39      # generate bins based on input$bins from ui.R
40      x    <- faithful[, 2]
41      bins <- seq(min(x), max(x), length.out = input$bins + 1)
42
43      # draw the histogram with the specified number of bins
44      hist(x, breaks = bins, col = 'darkgray', border = 'white')
45   })
46}
47
48# Run the application
49shinyApp(ui = ui, server = server)
The existing code is mostly for an example app, so we can trim it down to just this:
 1library(shiny)
 2
 3# Define UI for application
 4ui <-
 5
 6# Define server logic
 7server <- function(input, output) {
 8
 9}
10
11# Run the application
12shinyApp(ui = ui, server = server)
Step 2: Make part of the app
The app works using the built-in iris dataset, so we don't need to upload any new data for the app to work.
UI Structure
At the head of the ui chunk we use the function pageWithSidebar. This specifies that we want a page with a title, a sidebar with input options, and a main panel that shows our output (e.g. plots). There are other page formats that can be used as well. Change the ui portion of your script to look like this:
1ui <- pageWithSidebar(
2
3)
pageWithSidebar requires that we specify the headerPanel, sidebarPanel,
and mainPanel. headerPanel creates a panel for the app's title at the top of the page. sidebarPanel creates a sidebar for us to give the user input options (e.g., dropdown menus). mainPanel creates a space in the center of the page for output, like plots.
Change the ui portion of the script to match what's below, and click Run App!
1# Define UI for application
2ui <- pageWithSidebar(
3  headerPanel(title = "Test title"),
4  sidebarPanel(),
5  mainPanel()
6
7)
You'll see that the app launches successfully, but doesn't really contain much yet.
Next, we define the inputs that our app's users will have. Below we add two calls of selectInput, which creates a dropdown menu of options to select in the app. We populate one of these with options for an x-variable and one for a y-variable. inputId creates a variable out of the user's input choice that we can reference in the server function. label defines the label above the dropdown menu on the app page. choices specifies what will be in the dropdown. selected defines the default choice (i.e., the first iris column for x and the second one for y).
 1# Define UI for application
 2ui <- pageWithSidebar(
 3  headerPanel(title = "Test title"),
 4  sidebarPanel(
 5    selectInput(inputId = 'xcol', label = 'X Variable', choices = names(iris), selected = names(iris)[1]),
 6    selectInput('ycol', 'Y Variable', names(iris), selected = names(iris)[2])
 7  ),
 8  mainPanel()
 9
10)
Lastly, we put plotOutput('plot1') into the mainPanel function call. This specifies that the plot called "plot 1" from the server function we write later on will be displayed in the main panel space of our app page.
 1ui <- pageWithSidebar(
 2  headerPanel(title = "Test title"),
 3  sidebarPanel(
 4    selectInput('xcol', 'X Variable', names(iris), selected = names(iris)[1]),
 5    selectInput('ycol', 'Y Variable', names(iris), selected = names(iris)[2])
 6  ),
 7  mainPanel(
 8    plotOutput('plot1')
 9  )
10
11)
You should now have something that looks like this when you run the app:

Server Function
The way the server function works in this instance is to take the user's inputs (two selected columns) and to automatically subset the original iris dataset to include only these data. This subset is then fed into a plot ("plot 1"), which we display back to the user.
The first step in our server function is subsetting the data. We use the wrapper reactive({}), which makes the expression iris[, c(input$xcol, input$ycol)] respond to user inputs. This means the value of iris[, c(input$xcol, input$ycol)] changes as the user selects new columns for input$xcol and input$ycol. We save this new subset of the data as the object selectedData when its value changes.
1server <- function(input, output) {
2
3  selectedData <- reactive({
4    iris[, c(input$xcol, input$ycol)]
5  })
6
7}
Now, we want to make that plot show up on our app page.
In the code block below we assign a formatted plot to output$plot1. Here, output is an object that contains entries for each of the objects we're creating and displaying. Otherwise, they don't get used or get connected back to the ui.
So, "plot1" up in the ui is now fulfilled by output$plot1. R knows what to fill in for that value. Specifically, we're telling it to render a plot of the user-specified data frame selectedData.
1output$plot1 <- renderPlot({
2
3    plot(selectedData(),
4         pch = 20, cex = 3)
5
6  })
The resulting script should look like this:
 1library(shiny)
 2
 3# Define UI for application
 4ui <- pageWithSidebar(
 5  headerPanel(title = "Test title"),
 6  sidebarPanel(
 7    selectInput('xcol', 'X Variable', names(iris), selected = names(iris)[1]),
 8    selectInput('ycol', 'Y Variable', names(iris), selected = names(iris)[2])
 9  ),
10  mainPanel(
11    plotOutput('plot1')
12  )
13
14)
15
16# Define server logic
17server <- function(input, output) {
18
19  selectedData <- reactive({
20    iris[, c(input$xcol, input$ycol)]
21  })
22
23  output$plot1 <- renderPlot({
24
25    plot(selectedData(),
26         pch = 20, cex = 3)
27
28  })
29
30}
31
32# Run the application
33shinyApp(ui = ui, server = server)
Go ahead and run the app to make sure it works!
Step 3: Upload to the interwebs (for free!)
Now that we have a functional Shiny app, we probably want to put it up online for other people to use (or for us to use without needing to have R installed).
To do so, we must follow a couple of steps:
1. Install rsconnect package This package contains tools we need to deploy our app to the internet.
2. Create an account on shinyapps.io This is where we will upload our app. Note that the account name you choose will be part of the URL for all of your web apps. For example, if you chose "user1" as your account name and "test" as your app name, the app would be found at https://user1.shinyapps.io/test/
3. Connect rsconnect to your shinyapps.io account Follow either method 1 or method 2 here under "Configure rsconnect" to do so.
4. Deploy Once you've done the three steps above, open your app and run the code below in the Console (as opposed to writing it into your script):
1library(rsconnect)
2deployApp()
Make sure that your working directory is set to your app's main folder. Otherwise, you might upload the contents of a different folder to shinyapps.io.
Step 4: Bonus points
If we want to spice things up visually, we could also give the user the option to color-code the data by species. To do so, we change the following things in the ui and server function:
ui:
Add the following code chunk to sidebarPanel:
1checkboxInput(inputId = "spcol", label = "Color by Species", value = TRUE)
server:
Alter the plotting with an if() statement, so that if the user chooses to
color-code, the plot changes as a reaction to checkboxInput() in the ui. We also want to be more specific in referencing columns of the data frame, because we're adding a third variable. R can't guess as easily about how we want to plot three variables vs. two.
The final product should look like this:
 1library(shiny)
 2
 3# Define UI for application
 4ui <- pageWithSidebar(
 5  headerPanel(title = "Test title"),
 6  sidebarPanel(
 7    selectInput('xcol', 'X Variable', names(iris), selected = names(iris)[1]),
 8    selectInput('ycol', 'Y Variable', names(iris), selected = names(iris)[2]),
 9    checkboxInput(inputId = "spcol", label = "Color by Species", value = TRUE)
10  ),
11  mainPanel(
12    plotOutput('plot1')
13  )
14
15)
16
17# Define server logic
18server <- function(input, output) {
19
20  selectedData <- reactive({
21    iris[, c(input$xcol, input$ycol, "Species")]
22  })
23
24  output$plot1 <- renderPlot({
25
26    if(input$spcol){
27    plot(selectedData()[,1] ~ selectedData()[,2],
28         pch = 20, cex = 3, col = iris$Species,
29         xlab = names(selectedData())[1],
30         ylab = names(selectedData())[2])
31
32    } else{
33
34      plot(selectedData()[,1] ~ selectedData()[,2],
35           pch = 20, cex = 3, xlab = names(selectedData())[1],
36           ylab = names(selectedData())[2])
37
38    }
39
40  })
41
42}
43
44# Run the application
45shinyApp(ui = ui, server = server)
Sources:
https://shiny.rstudio.com/ https://shiny.rstudio.com/articles/basics.html https://shiny.rstudio.com/tutorial/written-tutorial/lesson4/ https://shiny.rstudio.com/articles/shinyapps.html