CougRstats Blog
Home
Archives
Links icon
Visit us at wsu.edu Follow us on Twitter View past talks on YouTube
About
English
  • Sharing and cleaning data

    Apr 1, 2020 · 5 min read · cleaning formatting janitor sharing code  ·
    Share on:

    By Abigail Hudak Overview The goal of this document is to share some tips and ideas about structuring and cleaning data for sharing and collaborating. None of the concepts are comprehensive, but I hope you find some useful tips. Cleaning data Favorites of janitor The package janitor is awesome for data cleaning. …

    Read More
  • Intro to Shiny

    Mar 11, 2020 · 1 min read · shiny  ·
    Share on:

    By Matt Brousil For the blog post accompanying this week's Intro to Shiny talk, please visit our previous post about Shiny: https://cougrstats.netlify.app/post/how-to-shiny-2/

    Read More
  • An introduction to working with lists using purrr

    Feb 19, 2020 · 11 min read · advanced loops purrr tidyverse  ·
    Share on:

    By Matt Brousil This week I'm going to walk through some examples of applying functions to every item in one (or more) lists. Basically this gives an overview answering the question: "If I have a list of data, how do I loop through that list manipulating and running analyses on its data without using for() …

    Read More
  • R functions and the Apply family

    Feb 12, 2020 · 11 min read · apply functions lapply  ·
    Share on:

    By Vera Pfeiffer Data for today 1BadFungi<-read.csv("BadFun.csv", row.names=1) 2head(BadFungi) 3 4## Botrytis Cladosporium Monilinia 5## X10orgedge 0.02131367 0.15160858 0.04504021 6## X10orgint 0.02654155 0.09718499 0.03900804 7## X11convedge 0.04959786 0.24664879 0.02560322 8## X11convint 0.03391421 …

    Read More
  • Non-metric Multidimensional Scaling (NMDS) in R

    Dec 11, 2019 · 9 min read · NMDS  ·
    Share on:
    Non-metric Multidimensional Scaling (NMDS) in R

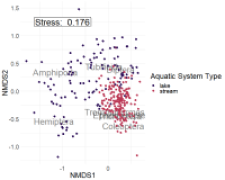
    By Michael Meyer Summary This document details the general workflow for performing Non-metric Multidimensional Scaling (NMDS), using macroinvertebrate composition data from the National Ecological Observatory Network (NEON). NMDS is a tool to assess similarity between samples when considering multiple variables of …

    Read More
  • SEM Lesson for R Working Group

    Dec 3, 2019 · 7 min read · Structural Equation Modeling  ·
    Share on:

    By Ben Lee Data for this walkthrough are available here. Why Use an SEM? Autocorrelation is everywhere in Ecological data, and fundamentally violates the assumptions of univariate linear models. Path analysis allows us to partition the variance of responses through a series of linear models. In our example, we'll be …

    Read More
  • Nonlinear regression tutorial

    Oct 23, 2019 · 7 min read · nonlinear regression regression  ·
    Share on:

    By Abby Hudak When relationships between variables is not linear you can try: transforming data to linearize the relationship fit non-linear functions to data (use nls example) fit polynomial or spline models to data (use growthrates package example) linear regression: dependent variable = constant + parameter x …

    Read More
  • ggplotting shapefiles

    Oct 17, 2019 · 5 min read · ggplot2 mapping shapefiles  ·
    Share on:

    By Carly Prior Load these libraries 1library(ggplot2) 2library(maptools) 3library(maps) 4library(rgdal) 5library(sp) 6library(raster) 7library(plyr) 8library(dplyr) 9library(knitr) 10library(tidyverse) What is a shapefile? A shapefile is a specific format for geospatial vector data describing points, lines or polygons. …

    Read More
  • Clustering in R

    Oct 2, 2019 · 5 min read · clustering  ·
    Share on:

    By Enrique Jimenez 1library(ggplot2) 2 3## Warning: package 'ggplot2' was built under R version 3.5.3 4 5library(ggpubr) 6 7## Warning: package 'ggpubr' was built under R version 3.5.3 8 9library(cluster) 10 11## Warning: package 'cluster' was built under R version 3.5.3 12 13library(factoextra) …

    Read More
  • Advanced methods with ggplot2

    Sep 25, 2019 · 11 min read · cowplot ggplot2 ggpubr ggrepel tidyverse  ·
    Share on:
    Advanced methods with ggplot2

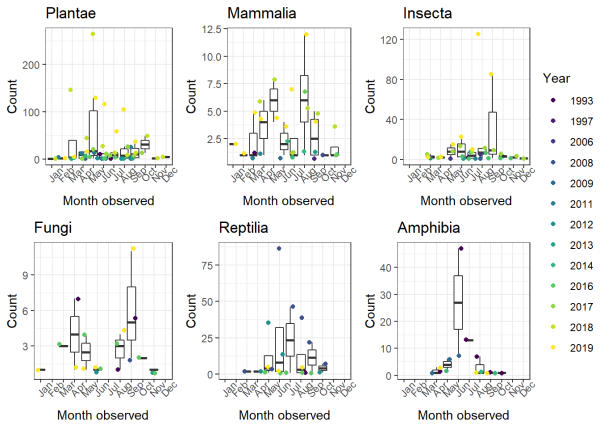
    This walkthrough will cover some advanced ways of working with ggplot2. There are a lot of functions and plotting options available in ggplot2, but here I'll be showing a couple of examples of ways to extend your ggplot2 usage with additional packages. This post is less about mind-blowing images as it is useful ways to …

    Read More
    • ««
    • «
    • 1
    • 2
    • 3
    • 4
    • 5
    • »
    • »»

CougRstats Blog

Welcome to the blog for the WSU R working group. Join us!
Stats | Modeling | Data Science | Team Science
Read More

Featured Posts

  • Raster parallel process in R
  • Using Python in R Studio with Reticulate
  • Non-metric Multidimensional Scaling (NMDS) in R

Recent Posts

  • Raster parallel process in R
  • Using Python in R Studio with Reticulate
  • Feature Engineering with Sliding Windows and Lagged Inputs
  • Introduction to mapping in R
  • Research profiles with Shiny Dashboard: A case study in a community survey for antimicrobial resistance in Guatemala

Categories

PACKAGE-INTRODUCTIONS 21 RESEARCH-PROFILES 10 INTRODUCTION-TO-R 6

Tags

GGPLOT2 6 TIDYVERSE 5 DATE/TIME 4 MAPPING 4 SHINY 4 HTML 3 JANITOR 3 RSTUDIO 3 ADVANCED 2 BEGINNER 2 COLLABORATION 2 COWPLOT 2 DATA-FORMATTING 2 DPLYR 2
All Tags
ACF1 ADVANCED2 APPLY1 ARIMA1 ASTSA1 BEGINNER2 BEST-PRACTICES1 CLEANING1 CLUSTERING1 CODE-PROFILING1 COLLABORATION2 COWPLOT2 DATA-CARPENTRY1 DATA-FORMATTING2 DATA-WRANGLING1 DATA.TABLE1 DATE1 DATE/TIME4 DISCRIMINANT-ANALYSIS1 DOWNLOADER1 DPLYR2 FORCASTING1 FOREACH1 FORMATTING1 FUNCTIONS1 GGPLOT26 GGPUBR1 GGREPEL1 GIS1 GLMULTI1 GRID1 GUEST-SPEAKER1 HTML3 INDEX1 INSTALL2 INTERACTIVE1 JANITOR3 LAPPLY1 LINEAR-REGRESSION1 LOOPS1 LUBRIDATE1 MAPPING4 MAPVIEW1 MODEL-SELECTION1 MRT1 MULTIPLE-REGRESSION1 MULTIVARIATE1 NCDF1 NMDS1 NONLINEAR-REGRESSION1 PACF1 PARALLEL1 POSIXCT1 POSIXLT1 PROC1 PURRR1 PYTHON2 R1 R-MARKDOWN1 R/PYTHON2 RASTER2 REGRESSION1 REPRODUCIBILITY1 RESEARCH-PROFILES1 RESOURCE2 RETICULATE1 RMARKDOWN1 RSTUDIO3 RVEST2 SF2 SHAPEFILES1 SHARING-CODE1 SHINY4 SNOW1 SOFTWARE-CARPENTRY1 SPATIAL-DATA1 SPDATA1 SPDATALARGE1 SPECIES1 SPEED1 STRUCTURAL-EQUATION-MODELING1 TEXT-ANALYSIS1 TIDYVERSE5 TIME-SERIES2 TMAP1 VEGAN1 VENOM1 WEB-INTERFACE1 WEBSCRAPING2 ZOO1
[A~Z][0~9]

Twitter Activity

    Tweets by CougRstats
CougRstats Blog

Copyright 2021- 2025 COUGRSTATS BLOG. All Rights Reserved